- Published On: July 07, 2026
The Hidden Map of America’s Power Grid: Why Your Electric Bill Differs from Other States?
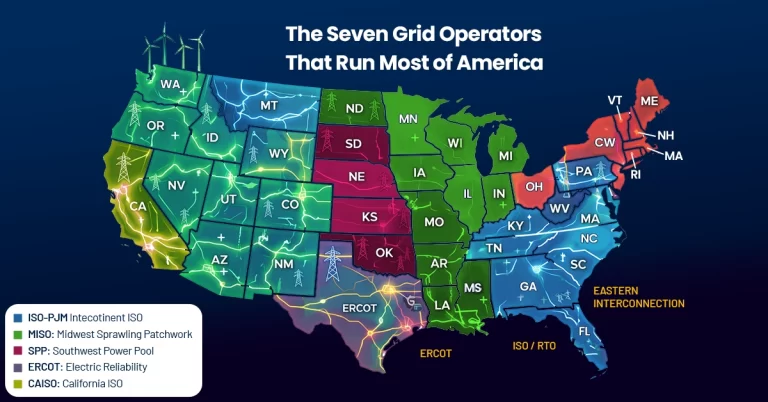
Do you ever think about who determines the cost of your electricity when you get your power bill? Most people simply see the price and pay the bill, assuming it depends on their utility provider, state, or the increasing prices of fuel. However, the determining factor behind your monthly bill is something much more complicated. There are six dominant electricity markets in the U.S. including ERCOT, PJM Interconnection, MISO, CAISO, SPP, and NYISO. They quietly control how electricity is generated, traded, and priced, long before it ever shows up as a line item on your statement. While you may not have any idea about these borders on the map, they determine what price of electricity you will get. Like, two neighbors, living a few miles from each other but in different grid operator zones, will get completely different electricity bills.
Knowing your grid operator is important to understand variations in your energy bills. The increased demand for AI data centers, the push towards electrification, climate change, and the deterioration of our aged infrastructure, the regional market is directly affecting your electricity bill in various ways. In this article, we will explore the unseen grid map of America and explain why it matters to know your regional market. Also, we will talk about a reliable solution to control your power costs.
What is a grid operator?
Most people believe that the electricity utility company “runs the grid.” This is true for about two-thirds of the U.S., where there are wholesale electricity markets. However, there is another entity, Independent System Operator (ISO) or the Regional Transmission Operator (RTO). It does two other things behind the scenes: maintains the balance of the high voltage transmission grid and conducts the wholesale electricity market where the power plants sell electricity to utilities.
In reality, “ISO” and “RTO” refer to one and the same organization. All RTOs are ISOs; however, RTOs comply with some additional federal requirements. ISOs regulate federally by non-profit organizations that are invisible to most of the customers. Nonetheless, as stated by the Sustainable FERC Project, the RTOs in the U.S. manage the electricity needs of approximately 192 million people and supervise billions of dollars of wholesale power transactions annually.
Check Your Solar Savings with our Smart Solar Calculator!
Start with a free tailored solar quote, compare brands and financing options, and explore your potential with zero obligation.
The Major U.S. Grid Operators
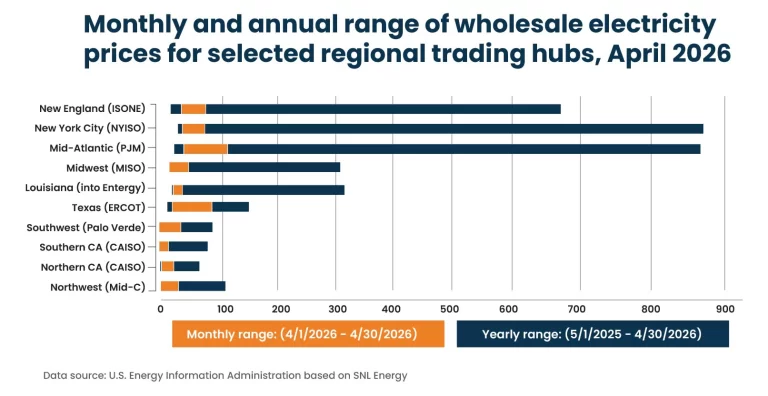
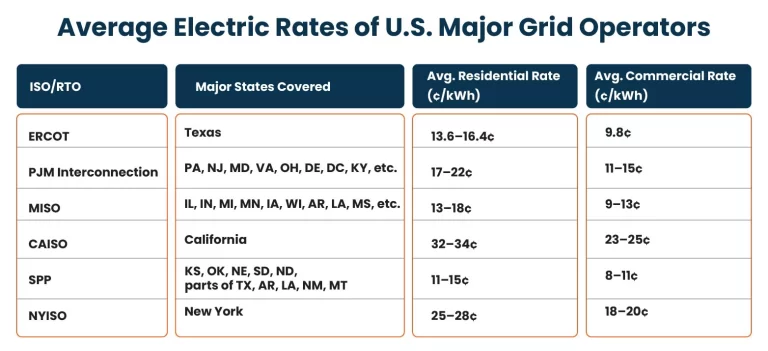
Although each grid operator has the same core purpose of ensuring safe delivery of electricity in the area of operation, the regions and conditions they operate under are quite different. For that reason, the costs of production, delivery, and purchase of electricity vary from state to state. Knowledge of which particular grid operator operates in your area can provide insight into your electric bill.
ERCOT: Texas
The Electric Reliability Council of Texas is responsible for operating the grid in almost all of Texas. ERCOT is unique among other grid operators for one very important reason that is electrically isolated from the rest of the country. Since ERCOT delivers power only within the state borders, it is not in interstate commerce and, thus, is not regulated by FERC but rather the Public Utility Commission of Texas and Texas Legislature. ERCOT operates an “energy-only” market without any capacity market, relying on scarcity pricing to encourage investments in generation capacity.
This grid design faced challenges during Winter Storm Uri in February 2021. Electricity demand reached an all-time peak. At the same time, the cold weather shut down 1/3 of generating capacity. ERCOT faced the largest ever blackout. The winter storm caused at least 246 confirmed deaths in Texas, and economic damage from the event amounts to between $80 and $300 billion based on different methodologies.
PJM Interconnection
PJM is the largest competitive wholesale electricity market in the world in terms of load. It encompasses 13 states and Washington D.C. Its geographic range extends from Illinois and Michigan to the west, and from New Jersey and Delaware to the east, serving 67 million people in total. PJM uses capacity markets where plants are compensated not only for generation, but also for their availability on the grid system. This model is currently under great stress. The capacity auction for the 2025-2026 delivery year conducted by PJM came in at $269.92 per megawatt-day, marking a rise of about 800% from the previous year. The latest auction by PJM, for 2027-2028 delivery year, once more reached its all-time maximum of $333.44 per megawatt-day in December 2025.
The cause for this trend is primarily data centers. According to PJM’s own market monitor, Monitoring Analytics, data centers were the cause of 63% of the price increase in the 2025-2026 auction, amounting to about $9.3 billion additional cost burdened on ratepayers. Customers of Pepco in Washington, D.C. saw their bills increase by about $50 per month starting June 2025 as a direct result. Several governors in the PJM territory have voiced serious opposition to this trend. The savings of about $8.3-$9.9 billion in consumer spending due to the current price caps in recent auctions are attributed to the legal settlement made by Governor Josh Shapiro of Pennsylvania against PJM.
MISO
The Midcontinent Independent System Operator serves 15 states ranging from North Dakota south to Louisiana, as well as the Canadian province of Manitoba. This system is geographically the largest region, and one of the most varied, consisting of wind-powered northern states alongside natural gas and coal-powered southern states. MISO runs both energy and capacity markets, though its capacity structure is more regionalized than PJM’s. It has also seen utilities switch allegiances over the years. FirstEnergy and Duke Energy both left MISO for PJM in the early 2010s, reportedly chasing more favorable capacity market payments, illustrating just how much these market design choices shape utility decision-making and, eventually, customer rates.
CAISO
California Independent System Operator spans the majority of California and a small section of Nevada. It is renowned in the energy sector for the “duck curve,” which is a graph demonstrating how solar energy flows into the network during noon hours and tapers off sharply later in the evening when the need for energy increases. This leads to operational challenges and has made California make extensive investments in batteries.
CAISO does not operate any capacity market. Rather, it operates within the framework of resource adequacy that mandates utilities to make arrangements for sufficient amounts of generation capacity beforehand. CAISO obtains about 1/3 of its electricity from the Pacific Northwest and Southwest regions of the country. This means that California’s expenses on energy depend on weather conditions far beyond its boundaries.
SPP
Southwest Power Pool spans 14 states and serves most of the Great Plains, from North Dakota to Oklahoma and Texas panhandle regions that do not belong to ERCOT. As with CAISO, there is no mandatory capacity market that SPP operates.
Moreover, SPP had to contend with Winter Storm Uri, declaring a double Level 3 Emergency Energy Alert and ordering rolling blackouts within its 14-state footprint, alongside ERCOT’s troubles, demonstrating that extreme weather events ignore the borders of grids, despite billing systems having some jurisdiction there.
NYISO
New York Independent System Operator serves the entire State of New York. As with CAISO, NYISO operates in only one state, yet it is FERC-jurisdictional because New York’s grid interconnects with surrounding regions. The distinguishing attribute of NYISO is that it suffers from internal congestion. New York City is among the transmission-constrained regions in the country, which implies that power produced in upstate cannot move into the city as conveniently and inexpensively as expected. This is one of the reasons why electricity costs more in downstate New York as compared to upstate, despite both being served by the same grid operator.
ISO-NE
This RTO serves Maine, New Hampshire, Vermont, Massachusetts, Rhode Island, and most of Connecticut. ISO-NE has some of the highest electricity prices in the country due to its pipeline constraints for fueling power plants.
What are the top reasons for fluctuating electric bills in different states?
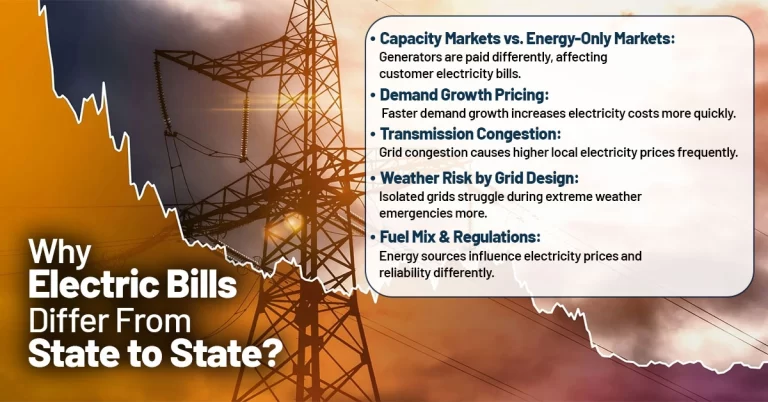
Your grid operator regulations directly affect your monthly bill. Also, availability of electricity supply, transmission costs, and seasonal demand all influence how much electricity costs in different parts of the country.
Capacity Market VS Energy Market: PJM, MISO, NYISO, and ISO-NE have capacity markets that provide payments to producers for being available during times of high demand. These are incorporated in the retail rates. However, ERCOT, CAISO, and SPP do not have mandatory capacity markets, which makes a difference in the way price spikes impact your bill.
Pace of Demand Growth: In PJM, the prices for capacity have grown in one year mainly due to the expansion of ai data centers. A consumer in MISO or SPP where demand has been growing slower just didn’t experience that shock yet.
Transmission Congestion: Living in downstate NY makes a consumer more vulnerable to local price spikes compared to a consumer in upstate NY, both belonging to NYISO. The same goes for other RTOs.
Fuel Prices and Regulation: CAISO’s solar penetration creates different costs than MISO’s wind-and-coal mix or PJM’s nuclear-and-gas blend. Each grid operator’s resource mix shapes both reliability risk and pricing in ways that ripple down to retail customers.
Why should you know about your grid operator?
For everyone, having knowledge about your RTO allows you to understand your electric bills fluctuations and differences. When you hear that “PJM’s capacity auction sets a record,” that’s not just industry news anymore. If you are a resident of Pennsylvania, New Jersey, Ohio, Virginia, or any of its other states, then you’re getting a glimpse of what is up to you in your next bills.
If you reside in a retail deregulated market within PJM, ERCOT, or a number of other RTOs, you will most likely be able to select your own electricity supplier and receive a fixed rate, thereby insulating yourself to some degree from fluctuations in capacity auctions. And, for those living in an area served by a single regulated utility without retail competition, the only way to exert some control is to decrease consumption during periods of peak demand.
For businesses, more gain or lose based on whether a firm operates in an RTO market versus elsewhere. A business located in PJM has access to one of the most developed demand response markets in the world. This is not the case for the same business if its location is in the non-RTO Southeast region.
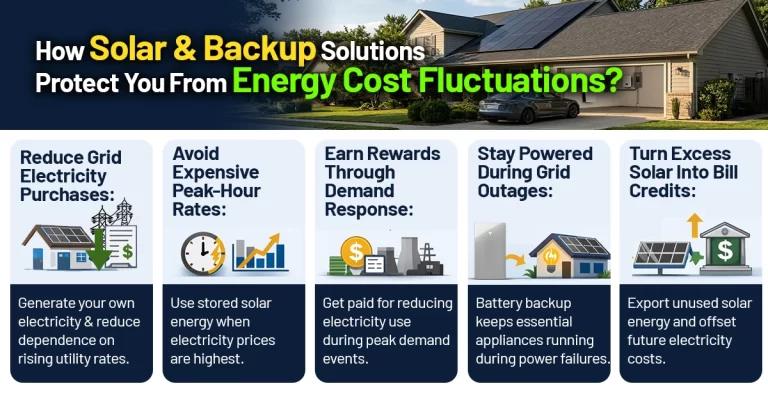
How solar & backup solutions protect You from energy cost fluctuations?
Once you know that your bill will be influenced by a regional market beyond your control, the question is how can you regain control. The solution for residential and commercial customers is generating and storing your own energy and minimizing dependence on the grid with a reliable solar with battery backup.
Solar Cuts How Much You Buy from the Market:
Every kilowatt hour produced by solar panels reduces your reliance on what is being charged for that energy through your RTO’s capacity auction each year. Like, last year, a PJM resident with solar panels protected from much of the jump in the cost of Pepco service that rose about $21 per month following record prices in the 2025-2026 auction.
Battery Storage Targets the Hours That Cost the Most:
Solar only systems do not operate at night when grid operators typically experience peak demand and peak prices. By charging your solar backup battery in the daytime and then using it during peak demand periods, you can avoid this problem. If you’re on demand-charge rates, where only your highest 15-minute peak charge is billed rather than total energy use, lowering that peak charge through a battery can save money with solar. For RTOs using capacity markets like PJM, NYISO, and MISO, decreasing how much power you use during the peak times also pays off because RTOs actually reward reductions in peak demand through demand response programs.
Backup Power Buys Resilience, Not Just Savings:
The changing weather conditions, like more hurricanes and storms across the U.S., have proved why backup power is a necessity now. Houses equipped with solar battery or generator backup had heating, cooling, and power supply while the whole grid system was under threat. Likewise, the long power outages, as well as multiple summer demand warnings, indicate the same trend: grid operators handle the problem of scarcity by disconnecting their customers when the backup power supply becomes critical.
Net Metering Turns Excess Power Into Bill Credits:
In the states where RTO operates, any unused energy generated by the solar panels is transferred back to the power grid as a credit for your electricity bill via net metering. The credit amount differs by state, as it is regulated by individual utilities; however, this makes the solar payback period shorter, and it provides extra protection from rate changes because you will not pay a full price.
In conclusion, America’s power grid isn’t one unified system, it’s a patchwork of regional markets, each with its own rules, pricing structures, and vulnerabilities, separated by borders most residents have never seen drawn on a map. Knowing whether you live under ERCOT, PJM, MISO, CAISO will change how much is your electric bill, and how much control you can actually have over it.
As electricity markets become more unpredictable, investing in solar panels and battery backup is one of the most effective ways to protect yourself from rising energy costs, grid disruptions, and future power crises. To explore the best solution for your home, contact SolarSME, a trusted local solar installer near you, and get a FREE personalized quote using our Smart Solar Calculator.
Check Your Solar Savings with our Smart Solar Calculator!
Start with a free tailored solar quote, compare brands and financing options, and explore your potential with zero obligation.
Related Articles:
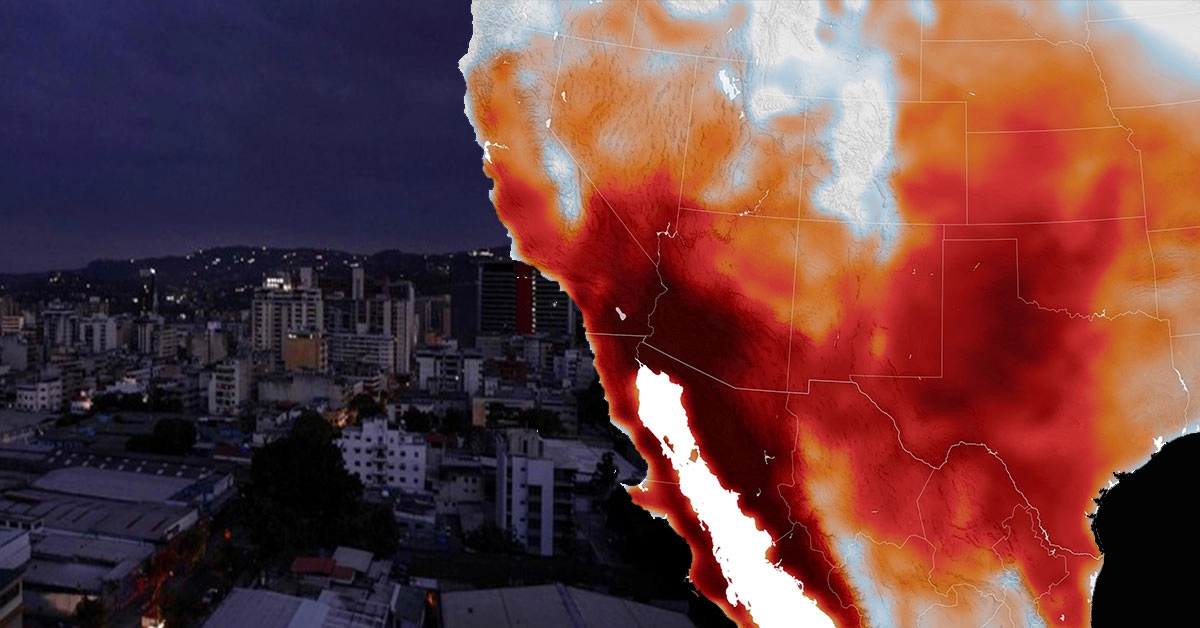
NERC’s 2026 summer outlook reveals increasing pressure on the U.S. power grid due to El Niño, heat domes, and rising electricity consumption. Find out how extreme weather and demand spikes may lead to blackout risks in your region this summer.
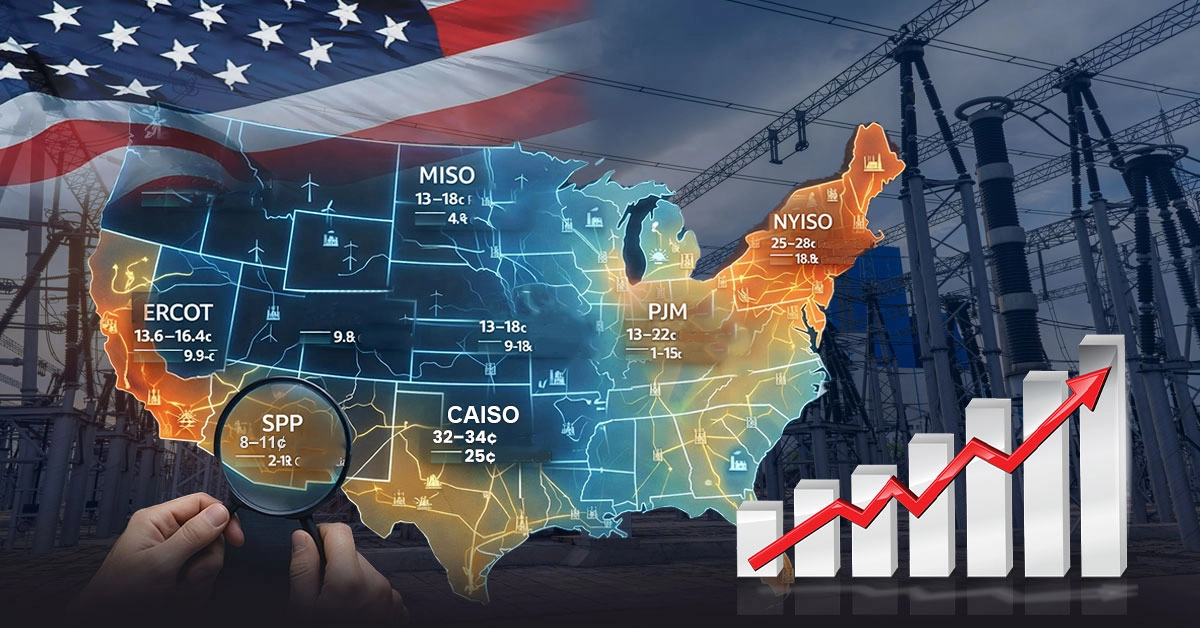
Rising utility prices and grid instability are changing how Americans power their homes. Explore why thousands of homeowners are investing in solar panels with battery storage to secure backup power, avoid peak electricity costs, and gain greater control over their household energy future.
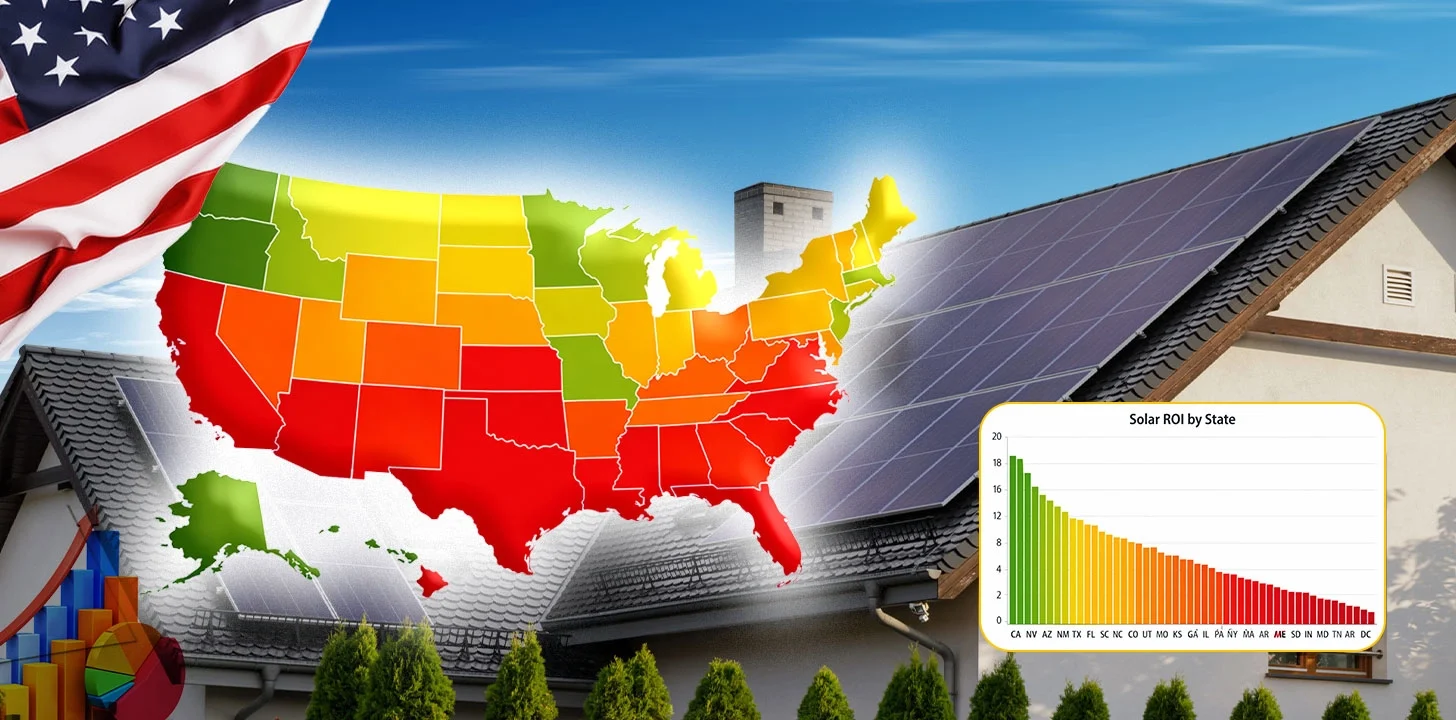
Looking for the best solar investment opportunities in 2026? This complete guide compares Solar ROI across U.S. states, covering incentives, electricity rates, payback timelines, and SREC benefits to help you identify where solar remains most profitable today.