- Published On: April 23, 2026
Solar ROI by State 2026: Which State Worth it for Solar Investment?
The outlook for solar investment in 2026 has undergone a complete transformation. First, as of December 31, 2025, the 30% federal residential solar tax credit expired due to “One Big Beautiful Bill. This marked the end of the primary solar energy incentive program in the history of the U.S. Almost a decade earlier than expected. Second, the nationwide average electricity price reached $0.1805/kWh in April 2026, rising by 5.4% over last year as estimated by the U.S. EIA. Moreover, the increase is 21% over the period of five years. On the one hand, the termination of the 30% solar tax credit prolongs the payback period by 3-4 years. On the other hand, higher electricity prices make solar adoption a necessity. However, solar ROI by state varies due to some factors.

Thus, in 2026, the profitability of using solar energy depends more various factors. These includes local electricity prices, net metering laws, the presence of SRECs, and state incentives. This complete guide to 2026 will walk you through a new payback period, SREC values, and state-specific incentives in major states where solar continues to be a good investment. Local knowledge of your regional market becomes the vital differentiator in making a great return on your solar investment.
The New Equation: How Solar ROI by State is Calculated in 2026?
In the “Post-ITC” era, for a residential homeowner, the traditional “ROI” is no longer simply the 30% tax cut up front. Rather, it is the “3- primary levers” approach including Avoided Utility Costs, State Performance Based Incentive Programs (PBIs), and Increased Property Values.
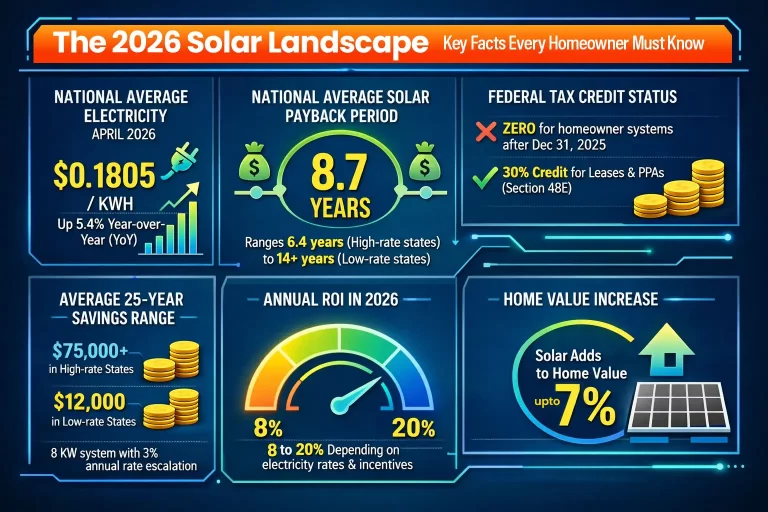
As utility prices rising at a rate of 5%/year, “Avoided Cost,” is most critical number in any solar investment. Moreover, there has been a tremendous shift from direct ownership to solar leasing or Power Purchase Agreements (PPAs). The reason? Third party solar system owners can still claim the Section 48E commercial credits and reduce homeowner expenses. Solar ROI is measured by comparing “Levelized Cost of Energy” (LCOE) to 25 years of utility costs.
Which states offer the best solar ROI in 2026?
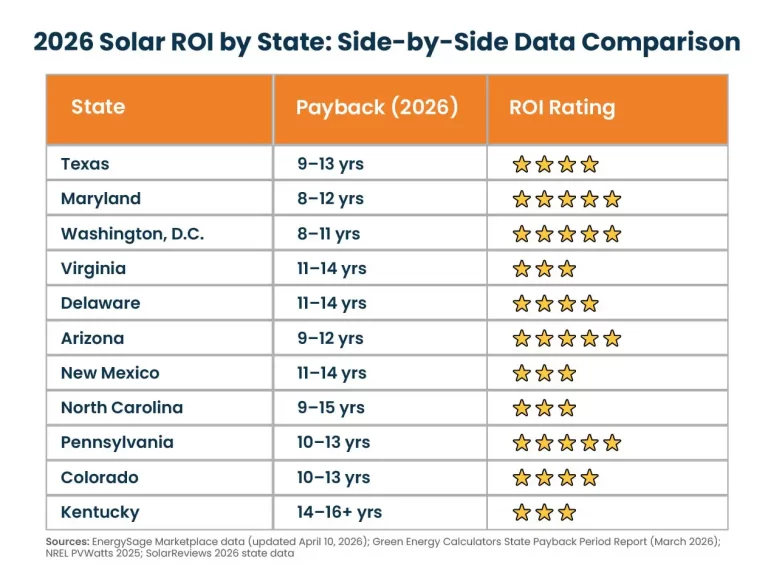
Before looking at each state, it’s essential to understand why the regional factor leads to such major disparities in the solar payback period. Below is the Solar ROI in each state. This will help homeowners to track where they can make the most savings in 2026 with solar.
1. Texas (TX): Populated Solar Market with Decent ROI:
Texas is still among the largest solar markets in the U.S. It ranks 2nd nationally in terms of solar capacity. According to SEIA, in 2026, Texas’ residential solar ROI is “good.” Texas’ utility rates reached $0.1569/kWh, or about 13% less than the U.S. average, reducing potential annual savings on electricity bills.
Solar incentives in Texas are typically provided at the utility level: property tax exemptions ensure that your solar panels do not increase your property taxes, while net metering is available via many retail electricity providers operating in the deregulated ERCOT region. Without the federal ITC, average annual savings in Texas now depends on system size and utility solar buyback rate. Also, payback stretches to 11–13 years in 2026.
Verdict on Solar ROI in Texas for 2026:
Mid-level Return on Investment. Suitable for high-consuming households in utilities providing full retail net metering services. Rate increases and low installation costs maintain future viability.
2. Maryland (MD): SREC Revenue + 5th Best Solar State:
Among the top-ranking states when it comes to solar ROI, Maryland is a top solar state. SRECs (Solar Renewable Energy Credits) in MD have remained an essential part of their solar incentive program. SRECs trade in MD at around $50-$80 per certificate. Since there is one certificate for per MWh, an average of 7,000 kWh will earn 7 SRECs per year. Or roughly $350-$560 in additional revenue. Also, the Maryland Residential Clean Energy Rebate program offers a $1,000 cash rebate to homeowners with residential solar system of more than 1 kW. Furthermore, Net metering is available at full retail value with no limit on system size. It is also among the best policies around. Moreover, the Maryland Solar Access Program offers low to moderate-income homeowners a rebate of up to $7500 for switching to solar power. However, it is a first-come, first-served program.
So, the total of 15 years’ SREC income ($10,000-$12,000 for SREC values 2026), together with a $1,000 incentive, and full retail net metering, means that Maryland falls into an elite category. It is among those states where 2026 brings a better effective ROI than the new national baseline.
MD Solar ROI Verdict 2026:
Top-Tier. SREC income, along with other Maryland solar grants, can help a homeowner reduce the upfront around 50%.
3. Washington D.C.: Highest SREC Values in the Nation:
Solar Installation costs in Washington D.C. are among the highest around ~$3.20/W. This is due to complex urban permits and high labor prices. But, the compensation comes through the nation’s best SREC market. As per April 2026, a DC SRECs is around $300-$400 or higher. For a 7-kW system generating 7,000 kWh/year, this means 7 SRECs or $2,100-$2,800/year are in addition to bill savings.
Also, Washington DC is a completely deregulated electricity market. This enables homeowners to have full freedom to find competitive rates for their electricity bill, and solar net metering. This helps reduce the overall bill further. Retail net metering is fully available. And DC’s participation in the mandatory Renewable Portfolio Standard (RPS) ensures that there will be sufficient demand for SRECs at all times.
Also, the elimination of the FTC, the high SREC value in combination with the above-average electricity rates makes solar adoption highly profitable. If you live in DC and your home is ideally oriented to get plenty of sunlight on its roof, then it is possible to see payback within 8-10 years in 2026.
DC Solar ROI Verdict 2026:
Washington DC‘s highest SREC prices in the country allow it to stand out among other states, where losing the federal ITC impacts significantly less than elsewhere.
4. Virginia (VA): Policy Momentum Fuels Growth:
The Virginia residential solar ROI outlook for 2026 is uneven but positive. Virginia electricity price of $0.13/kWh ranks 28% lower than the national average. Without FTC and low electricity rates, Virginia residential solar payback periods are between 11-14 years.
In comparison, Virginia’s commercial solar market looks very different. Virginia is first place out of all states in terms of ROI with a 21.05% return and a 5.36-year payback period. This is a clear sign of a favorable commercial solar policy and net metering terms. On the residential side, Virginia benefits from the Virginia Clean Economy Act, which requires that 100% of Virginia electricity generation will be carbon-free by 2045. Net metering at full retail value is applicable to residential solar systems below 25 kW. Also, Virginia offers 100% solar property tax exemption.
Virginia Solar ROI Verdict 2026:
Ideal for commercial and solar farming. Residences with above-average energy use and advantageous Dominion rates generate greater financial benefits.
5. Delaware (DE): Small State with SREC Availability:
Delaware is a deregulated electricity state. It also runs an SREC program, thus one of only six states in America in which homeowners receive tradeable certificates as a result of installing solar energy systems. An income stream in addition to savings on electricity bills compensates in part for the lack of federal ITC for residents who installed solar systems in 2026.
Also, Clean Energy Grant program is another Delaware solar incentive in addition to retail net metering and tax exemption. The deregulated electricity market in Delaware allows homeowners to switch to better electricity rates if necessary, making a combination of solar and fixed-rate plans feasible. Moreover, due to SRECs and grants, Delaware becomes a state with a strong incentive program overall.
Delaware Solar ROI Verdict 2026:
Good performer, especially for a small state. SREC opportunity sets Delaware apart from other states with moderate rates. Best ROI for big homes in the Wilmington or Dover area.
6. Arizona (AZ): Sun Capital Still Shines:
Despite federal tax credit expiry, Arizona continues to shine for solar installations in 2026. The combo of the lowest per-watt system cost in the country ($2.30-$2.65/W based on Q1 2026 SEIA stats) and the highest sun hours per day, is what gives AZ its excellent ROI prospects. In Arizona, one can take advantage of the 25% solar tax credit capped at $1,000 as well as exemptions for sales and property taxes. Also, net billing is available, though the Arizona Corporation Commission is considering revisions for better benefits. The numbers remain favorable in Arizona despite the end of the tax credit. Like a 7-kW system providing savings of $1,400-$1,900/yr based on current prices is paid back in 9-12 years, with 13-16 years of free power generation in future. With more than 300 sunny days annually in Arizona, a solar panel system performs close to maximum rated capacity throughout the year.
Arizona Solar ROI Verdict 2026:
Best value for money investment + unlimited sunlight = one of the best long-term value propositions for solar systems. The absence of the federal tax credit reduces but does not destroy the viability of solar in Arizona.
7. New Mexico (NM): Lower Prices, Exceptional Sunlight:
New Mexico is an interesting solar state in 2026: excellent solar availability (5+ peak sun hours in most of the state) combined with one of the lowest electricity prices in the US.
In the absence of the tax credit, yearly savings range between $1,200–$1,600 at an average of $0.13–$0.15/kWh per year, making solar payback periods of 11-14 years by 2026. For high-usage homes with high consumption rates of HVAC systems during hot summers in New Mexico, annual savings will scale accordingly.
Additionally, New Mexico offers market development tax credit, full retail net metering; property tax exempt; sales tax exempt on solar products. Renewable Portfolio Standard (target of 100% renewable energy by 2045) continues to provide a positive long-term policy support environment.
New Mexico Solar ROI Verdict 2026:
Great long-term investment potential due to outstanding sunshine and low installation costs. Better suited for high-usage homes. Available state tax credit is the main motivator that must be validated prior to signing any agreements.
8. North Carolina (NC): Among Largest Solar Capacity States:
North Carolina ranks 5th nationally by installed solar capacity (SEIA, February 2026). However, in 2026, the picture regarding residential payback varies greatly depending on utility territory. Residential rate for Duke Energy service territory (the majority of North Carolinians) is among the lowest in the state at approximately $0.11-$0.12/kWh, which is about 40% lower than the national average rate. The difference for Duke Energy customers in 2026 is the PowerPair program. Residents combining solar and batteries under this grant earn up to $9,000 in rebate ($0.36/W for solar + ~$400/kWh for battery capacity), plus continuing monthly bill credit of $23-$92 based on battery capacity and PowerPair enrollment. Due to Duke’s time-of-use-based electricity export payment model, battery systems shift the economics because they will maximize the consumption of locally produced solar energy and avoid the low price of export.
Moreover, for customers of Dominion Energy in the northeast part of NC, full retail 1:1 net metering applies, rolling monthly that leads to the short payback period of 9-11 years. NC law provides 100% property tax exemption for residential solar throughout the state.
NC Solar ROI 2026 Verdict:
Utility territory makes all the difference. For customers of Dominion Energy, solar is a very compelling investment. And for Duke Energy clients, invest in solar + battery combination and apply for the PowerPair rebate.
9. Pennsylvania (PA): SREC Program & Deregulated Electricity Market:
As one of the best ROI states, Pennsylvania will become even stronger in 2026. First of all, Pennsylvania is considered a deregulated electricity market. Hence, it allows residents to choose among different suppliers and save around 15% to 30% of their base electricity cost. However, homeowners will still be able to earn full retail credits in the net metering process.
Second, Pennsylvania SREC market, is among six states out of 50. This makes Pennsylvania an excellent place in terms of generating income from SRECs that range from $10 to $350 per credit. Moreover, an average system in Pennsylvania produces between 7,000 to 9,000 kWh per year or from 7 to 9 SRECs per year.
Finally, Pennsylvania has a net-metering policy that forces utilities companies to compensate households at a full retail rate. Besides tax exemptions, rising electricity prices by 5.4% nationally in 2025-2026, and the above-average electricity rates of $0.16-$0.18/kWh make this state’s solar fundamentals better each year.
Pennsylvania Solar ROI 2026 Verdict:
Among the best of all Mid-Atlantic states post-ITC. SREC revenue + flexibility of deregulated market + full retail net metering make the top incentives available in PA to 2026 consumers.
10. Colorado (CO): Mountain West Leader with 14% IRR:
Colorado ranks as the most attractive solar market in the Mountain West region in 2026, due to an impressive 5.3+ sun peak hours daily average, full retail net metering policy, including a 25-kW residential cap, along with a favorable and steady policy environment. According to research, Colorado demonstrates a 6-kW system producing an ROI rate of 14%.
Also, Colorado provides a solar tax credit at the state level (15% of purchase price, up to $1,000), a Solar Power Performance Payment ($.005-.0375/kWh based on system size), as well as solar sales and property tax exemption policies at the state level. This suite of incentives helps counteract the effects of the FTC.
Furthermore, Interconnection is well established at Xcel Energy, Colorado’s primary utility provider, and Xcel has set a goal of providing 100% carbon-free electricity via their generation mix. Moreover, Colorado is one of the most mature community solar markets in the country for renters or homeowners with unsuitable roof structures.
Colorado Solar ROI 2026 Verdict:
14% Internal Rate of Return (IRR) outperforms other traditional investments. The stable policy environment and several solar incentives in CO make it one of the best states for 2026 solar investments.
11. Kentucky (KY): An Honest Assessment of a Difficult Market:
Kentucky represents the most difficult market for solar energy investments. Kentucky’s electricity prices of $0.10-$0.12 per kWh indicate the state’s dependency on coal-fueled generation, making it one of the highest producers of coal in the United States. Without state-level incentives (no solar tax credit, no SREC markets, no rebates) and without the federal 30% ITC, homeowners in Kentucky now face the full pre-incentive cost of the system. That leads to a payback time of 14-18+ years for typical residential systems in 2026.
In other words, the truth is that Kentucky solar has its best prospects for installation on commercial/agricultural properties (which still qualify for a federal business investment credit, or ITC, through section 48E), on farms with higher consumption, as well as for homeowners focused on energy independence and stability. Batteries are increasingly becoming justified as investments in the reliability of the grid itself in Kentucky.
That being said, with US electricity rates increasing, prices in Kentucky can hardly remain at their current level. For long-time homeowners, installing solar systems now means locking themselves into a hedge against energy crisis, which becomes increasingly more valuable over time.
Kentucky Solar ROI 2026 Verdict:
Best suited are businesses, agricultural landowners, and those with a 15-year plus commitment to their home.
The Biggest Change in 2026: Is the Federal Solar Tax Credit Expiration Important than Savings?
With the expiration of the 30% residential credit Section 25D, the effective cost calculations will be different for an average system of 8 kW: let’s assume if
In 2025 (with 30% FTC): effective cost ≈ $15,960; payback period ≈ 9 years at average U.S. rates
In 2026 (without FTC): effective cost ≈ $22,800; payback period ≈ 12.5 years at average U.S. rates.
It’s around 3.5-year longer average payback, that’s significant, yet not decisive. As per increasing energy inflation rate, solar energy systems are still worth it for most American homeowners and businesses as well in 2026.
However, one important factor affecting solar power systems purchasers in 2026 is solar leases and PPAs remain eligible for the 30% federal tax credit under Section 48E (clean electricity ITC for commercial projects). As the leasing company becomes the owner of the system, you can save on taxes by receiving lower payments.
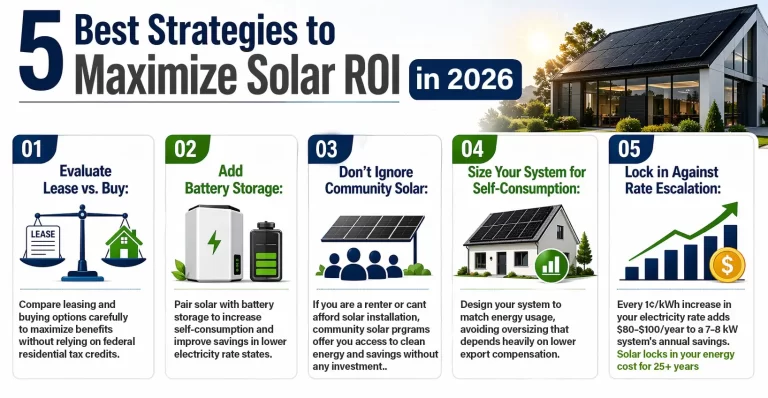
What are the best strategies to maximize solar ROI by state in 2026?
ROI on Solar Investments in 2026 will differ according to state as a result of changing incentives, electricity prices, and regulations, the return on solar investments will depend on which state they are made in. If something is working for Texas, it won’t necessarily have the same results in Virginia or Washington D.C. or in other states. Here are the best ways to maximize your solar ROI:
In conclusion, 2025 was an era for the federal tax credits for residential homeowners just in terms of big incentives for lowering upfront cost, but the economic proposition behind solar energy is still worth it. Homeowners that will succeed in 2026 are those who grasp their state’s incentives on time, smartly design the solar system and connect with a trusted solar installer.
Solar SME is a best local solar company offering complete solar services around 11 top solar states. You can get a FREE Online Estimate of your savings with solar.
Related Articles:

OBBBA brings critical updates to Solar ITC Safe Harbor in 2026. Discover IRS construction requirements, new enforcement on continuity, and essential deadlines developers must meet to secure tax incentives and avoid costly project delays.
The U.S. solar market is shaped by state solar policies and Renewable Portfolio Standards (RPS). This guide explores how incentives, net metering changes, and local challenges impact solar deployment and emerging opportunities for homeowners and the clean energy industry.

Solar panel cost is the key consideration. Learn how to make your solar journey more affordable even in the new solar tariffs era with best solar incentives and rebate programs!